Performance Rating
ASRock Arc A770 Challenger OC 16 GB outperforms Dell RTX A5000 Max-Q by 13.61% in the overall GPU ARK performance rating
Dell RTX A5000 Max-Q
Contents:
Memory ML Performance Compute Power Architecture & Compatibility ML Software Support Clocks & Performance Power Consumption Rendering AdditionalMemory
Memory Size
Memory Type
Memory Bandwidth
Memory Bus Width
ML Performance
FP16 (Half Precision)
 +120%
39.32
TFLOPS
+120%
39.32
TFLOPS
BF16 (Brain Float)
TF32 (TensorFloat)
Compute Power
FP32 (Single Precision)
+10%
19.66
TFLOPS
FP64 (Double Precision)
+780%
2.458
TFLOPS
CUDA Cores
+50%
6,144
RT Cores
+50%
48
Architecture & Compatibility
GPU Architecture
SM (Streaming Multiprocessor)
48
PCIe Version
ML Software Support
CUDA Version
Clocks & Performance
Base Clock
+147%
2,150
Boost Clock
+65%
2,400
Memory Clock
+46%
2,187
Power Consumption
Recommended PSU
Power Connector
TDP/TGP
-64%
80 W
Rendering
Texture Units (TMU)
+33%
256
ROP
+50%
48
L2 Cache
4 MB
Additional
Slots
Release Date
Display Outputs
Renting is cheaper than buying
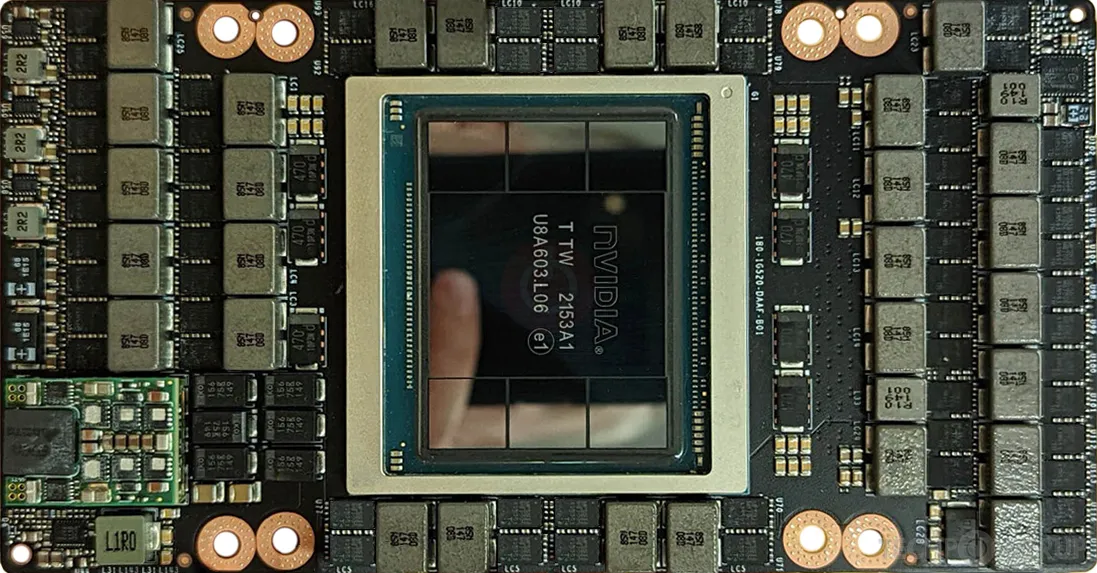
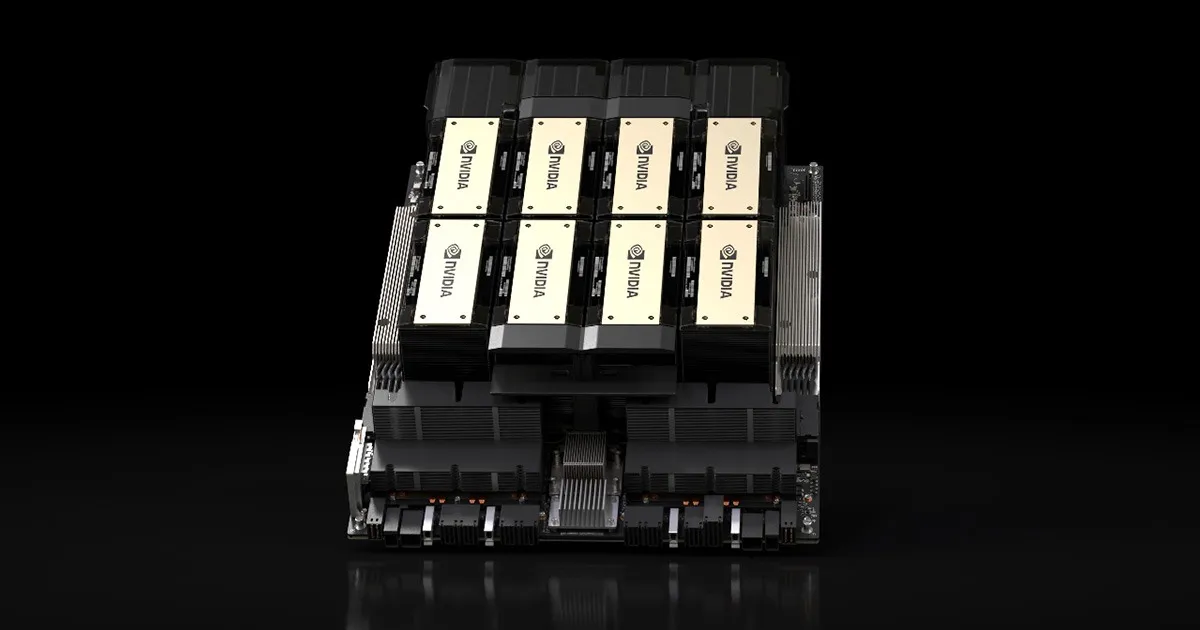
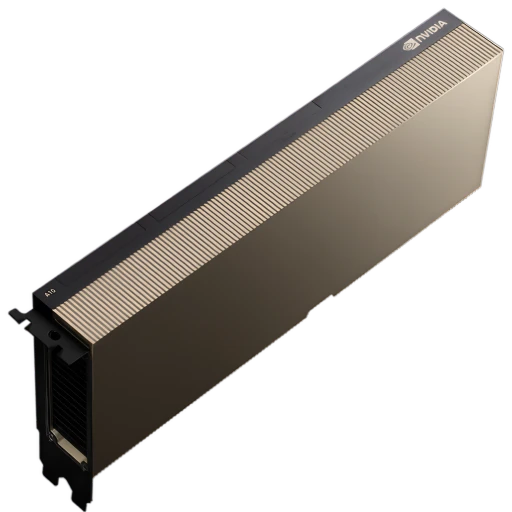
H100 80Gb SXM (80GB)
NVIDIA
Флагманская GPU на архитектуре Hopper с 80 ГБ памяти HBM3 в форм-факторе SXM. Создана для обучения и инференса больших языковых моделей, HPC задач. Поддерживает FP64, FP32, TF32, FP16, BF16, FP8 и INT8 вычисления с Tensor Cores 4-го поколения.
from 299.11 RUB/hour